
Sample moisture scan report
One real roof, scanned
A sample from a real drone moisture scan of a commercial roof of about 50,000 sq ft, with the address, the people and the companies removed and the map re-oriented: 28 areas flagged, 1,929 sq ft in all, 3.8% of the roof. It shows the map and the daylight and thermal image pairs; a full scan also comes with video from the flight and a written assessment.
What came back
The scan in numbers
Read the total first: 1,929 sq ft, 3.8% of the roof, is what may have to come out and go back once cores confirm it. There is no single standard for how much wet is too much; manufacturers commonly draw the line somewhere between 15% and 30% of the roof.
| Roof | A commercial roof of about 50,000 sq ft |
|---|---|
| Areas flagged | 28 |
| Flagged in total | 1,929 sq ft, 3.8% of the roof |
| Size of each area | From 2 sq ft to about 206 sq ft |
| Warmest area | 14.5 °F above the dry roof around it (pair A below) |
| Faintest areas | Nine of the 28 read less than 5 °F above the dry roof around them |
| When it was flown | A clear evening, about an hour after sunset |
| Cores taken | None in this sample |
Suspected until cored. Nothing in this sample was cored, so every outline is a suspect, and the 1,929 sq ft is the area to check, not the area to replace. The scan marks suspects; the cores confirm them.
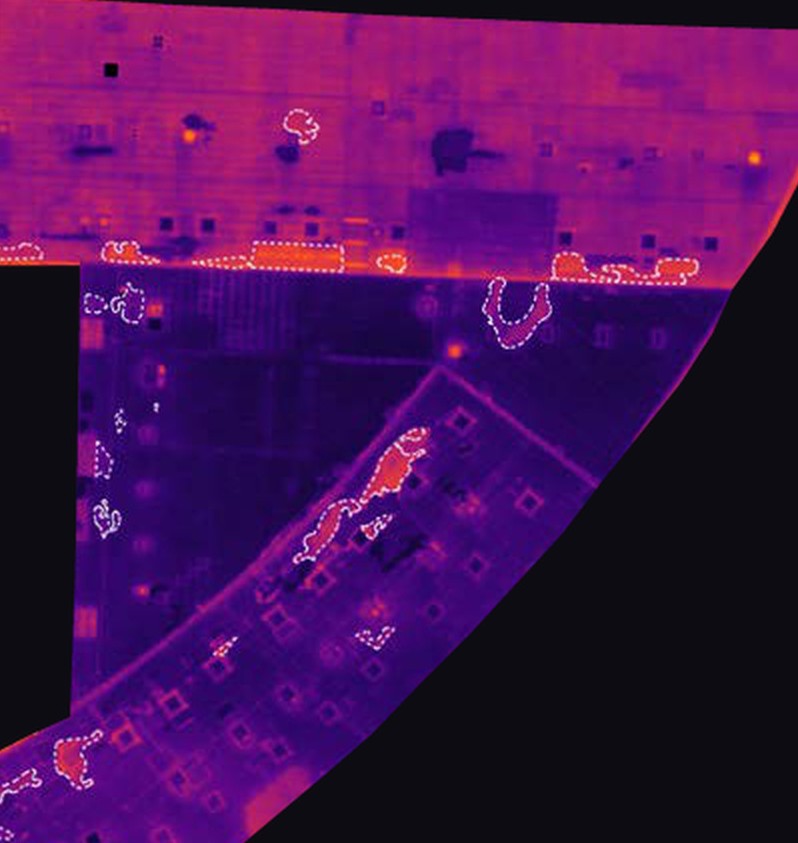
The whole-roof map
Reading the map
Brighter is warmer. Wet insulation holds the day's heat longer than dry insulation, so after sunset the membrane over it stays warmer than the roof around it. The white dotted outlines are the areas the scan flagged, each measured in square feet. On this roof they gather along the wall line where two sections meet, beside curbs and rooftop units, and around a ponding stain. Color alone proves nothing: unit exhaust, standing water, dirt and thicker membrane can each read warm over dry insulation. Every outline is a place to core, not a finding.
How infrared surveys work, and when they do notSix of the 28 areas
Slide from daylight to thermal
From the same sample, with the address, the people and the companies removed. Each pair is one patch of roof, lined up to match: slide across to wipe between the daylight photo and the thermal image. The dotted outline, orange on daylight and white on thermal, is the area flagged.
-
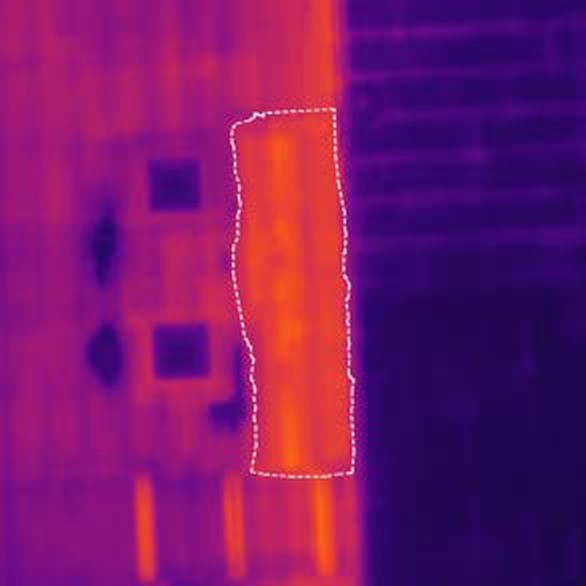
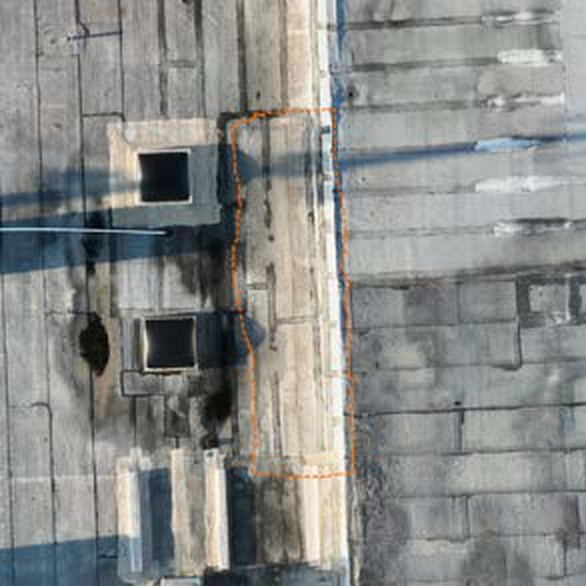
Pair A: a strip beside two rooftop curbs
 Daylight Thermal
- Area flagged
- 204.7 sq ft
- Warmer by
- 14.5 °F
- Peak
- 91.4 °F
The warmest area on the roof, a strip along the wall where two roof sections meet. Stains by day and a hot band after sunset in the same strip: two separate clues agreeing, which puts it first in line for a core. -
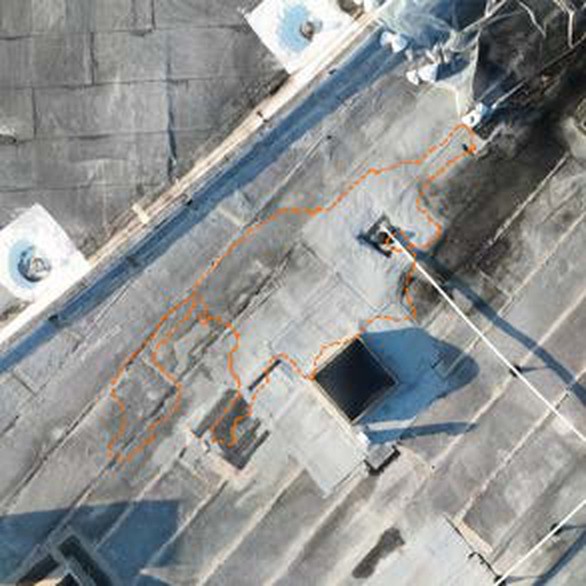
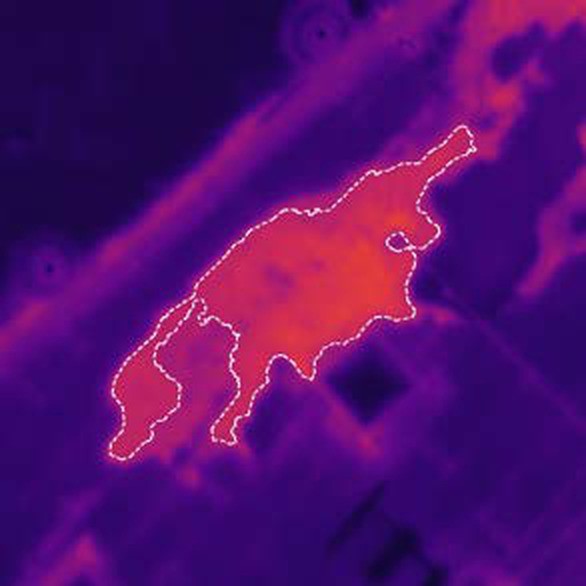
Pair B: between rooftop units
 Daylight
 Thermal
- Area flagged
- 140.9 sq ft
- Warmer by
- 12.9 °F
- Peak
- 88.8 °F
Second only to pair A among the six, at 12.9 °F above the dry roof around it, with the ragged, spreading edge that water moving through insulation tends to leave. Next in line for a core. -
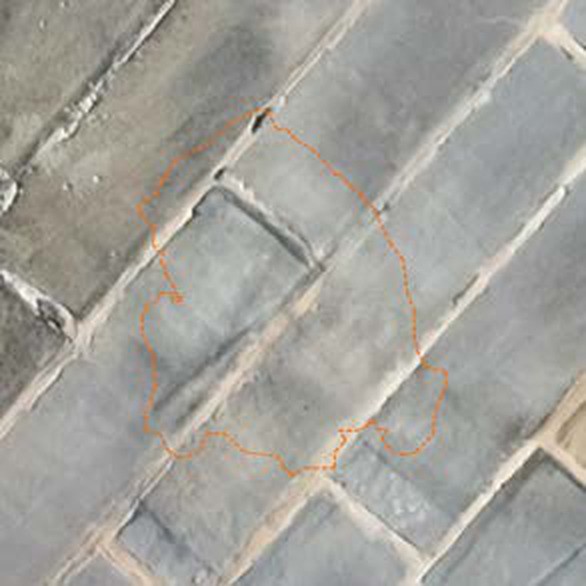
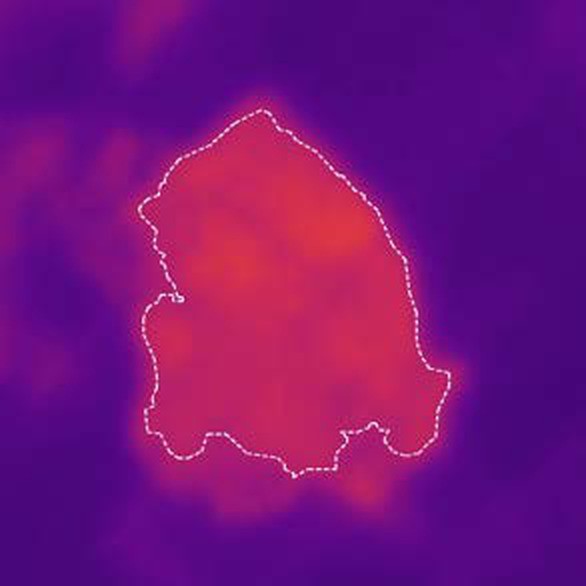
Pair C: nothing to see in daylight
 Daylight
 Thermal
- Area flagged
- 34.2 sq ft
- Warmer by
- 9.5 °F
- Peak
- 88.1 °F
The membrane looks like the roof around it. Nothing on the surface would lead anyone to cut here: the case for the camera. -
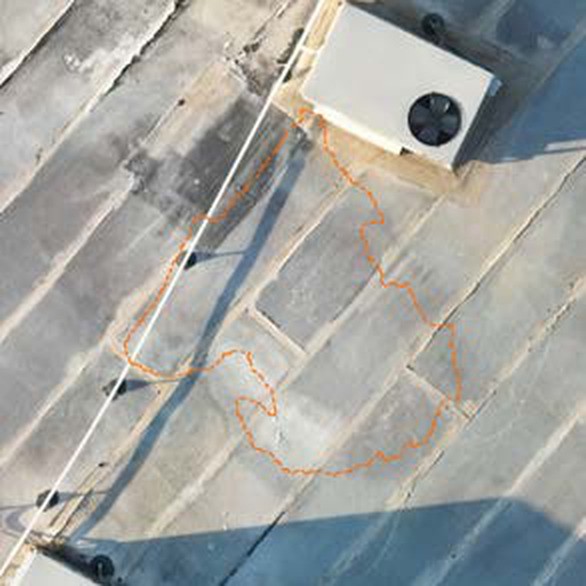
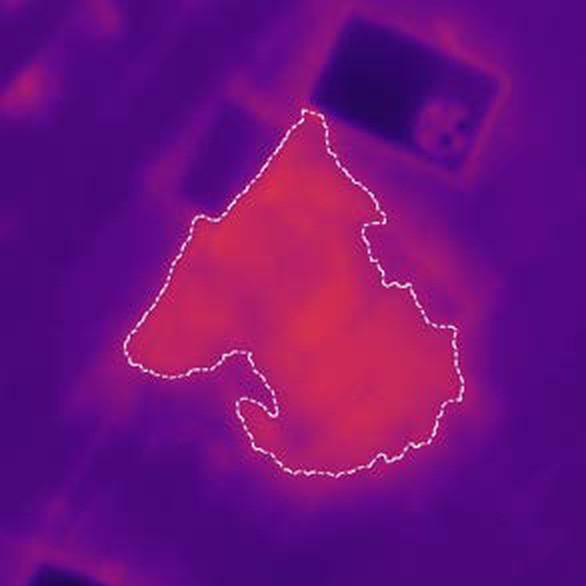
Pair D: beside an air-handling unit
 Daylight
 Thermal
- Area flagged
- 92.0 sq ft
- Warmer by
- 8.7 °F
- Peak
- 87.2 °F
The unit itself reads cool; the warm shape starts at its corner and spreads across the roof. The camera cannot see under the unit, so the outline stops at its edge whether or not the warmth does. -
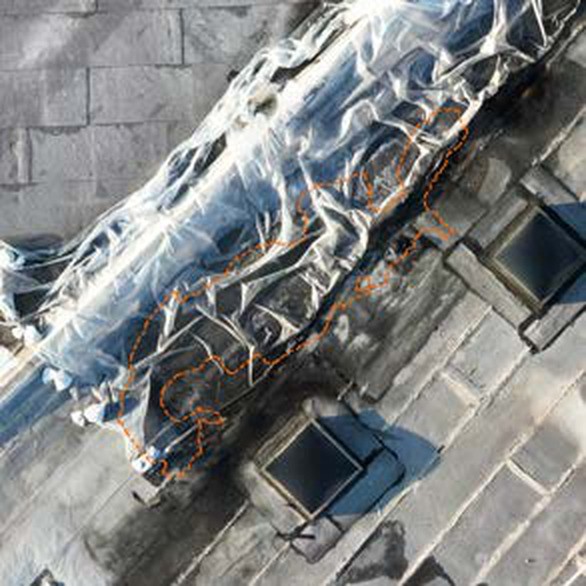
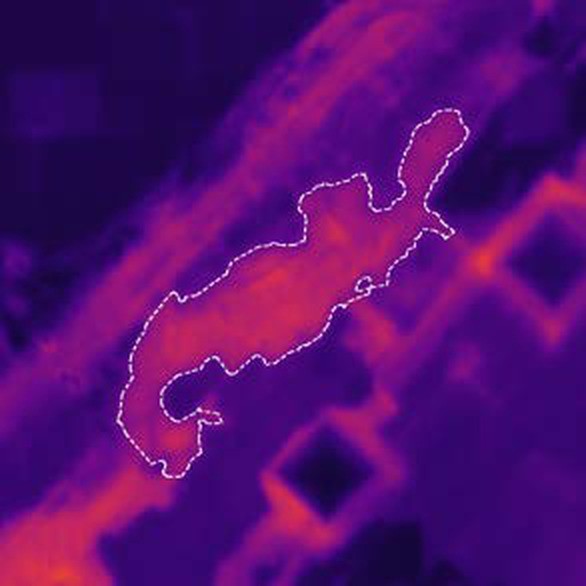
Pair E: under a temporary plastic cover
 Daylight
 Thermal
- Area flagged
- 112.7 sq ft
- Warmer by
- 10.5 °F
- Peak
- 86.5 °F
Someone had already laid a cover over a problem here. The flagged area lies under and around it, in a shape of its own: a repair sized to the plastic is sized to a guess. -
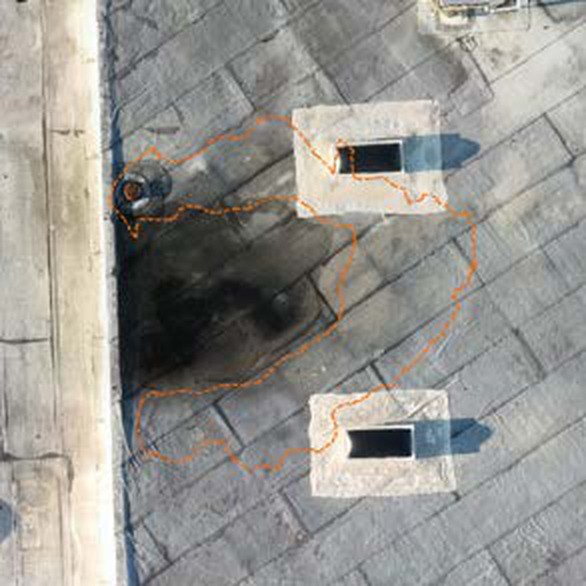
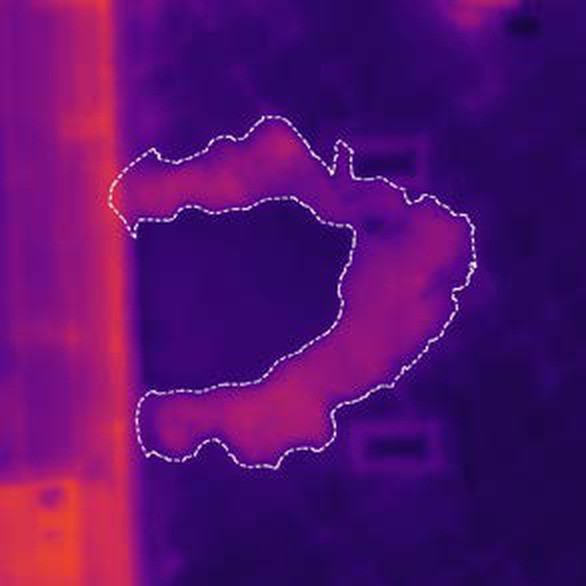
Pair F: a ring around a ponding stain
 Daylight
 Thermal
- Area flagged
- 176.2 sq ft
- Warmer by
- 8.5 °F
- Peak
- 84.5 °F
The stain itself reads no warmer than the open roof; the ring of roof around it is what was flagged. A stain is a clue to check, not the outline.
Area flagged is estimated from the air; the cut line is set on the roof. Peak is the warmest surface reading inside the outline. Warmer by is measured against the dry roof right around each area, not one figure for the whole roof.
Reading the pairs
What the six pairs teach
Read any scan report in the same order: what the pictures agree on, what only the camera can see, and what a core will have to settle.
-
Agreement ranks an area; it does not confirm it
Two clues in one place, as at pair A, put an area first in the coring order. It is still a suspect: a stain shows where water stood on the surface, not what is in the insulation.
-
What shows by day is a poor guide to the extent
Pair C shows nothing by day. At pairs E and F the outline takes its own shape, not the shape of the cover or the stain: only the camera shows where the warmth runs.
-
Small and faint is not the same as dry
Nine of the 28 read less than 5 °F above the dry roof around them. Wind blunts a thermal pattern, so faint areas are cored after the strong ones, and at least one still is.
-
Warmer than the roof around it, not the roof
Pair D peaked higher than pair E, yet E read 10.5 °F above its surroundings against 8.7 °F. Against one roof-wide figure the two would rank the other way round.
Next steps
After the map: cores, cut-outs, coating
The map says where to look, not what to do. A roofing contractor takes it from here: we work with a network of installers, roofing contractors who apply these systems, and can introduce you to one anywhere in the US, who looks at the roof and says whether it is a good candidate for restoration.
-
Core strong, faint and dry areas
A core is a small cut through the roof that shows the layers, the insulation and whether it is wet. Start with the warmest and largest areas, add a faint one, and cut one where the map shows nothing, for comparison. Each core is patched the day it is cut.
-
Mark the cut-outs on the roof plan
Areas the cores confirm go onto the roof plan, with cut lines set on the roof back to sound material, not traced from the air. Sherwin-Williams Uniflex's own guide specification asks for a roof plan of the wet areas before coating. The total is the square footage coming out and going back.
-
Replace what is wet, to matching thickness
Wet insulation and the membrane over it are cut back to sound material, the insulation is replaced to matching thickness, and the patch is tied back into the field. A coating over a wet area would seal the water in.
-
Restore the rest, by roof type
If the cores and the installer say the roof is a candidate, an adhesion test patch settles whether it holds. Then the build-up for its type: an acrylic base and finish coat, or Silicone44 with no base coat. Applied over a sound, dry roof, a restoration system adds 10 to 15 years of service life.
-
File the map and the core log
A white coating makes later thermal work harder, so the map and the core log are the record of what was under the membrane before the coating went on. Keep them with the cut-out plan and the data sheets for whoever works on the roof next.
Questions
About this sample
Is this a real roof?
What do the dotted outlines mark, and how exact are they?
What do the temperatures mean?
Does a small difference mean the roof is dry there?
What else is in a full scan?
What did this roof's owner do next?
Can a contractor ask for a scan of a client's roof?
Would a scan work on my roof?
Before you budget
Get the same kind of map for your roof
Send the building's address with the request. You get the map, video from the flight and a written assessment, and nothing has to be decided until you have seen them. We quote the scan for your roof; it depends on the roof's size and where the building is.