How to read a thermal roof scan report: the map and the numbers
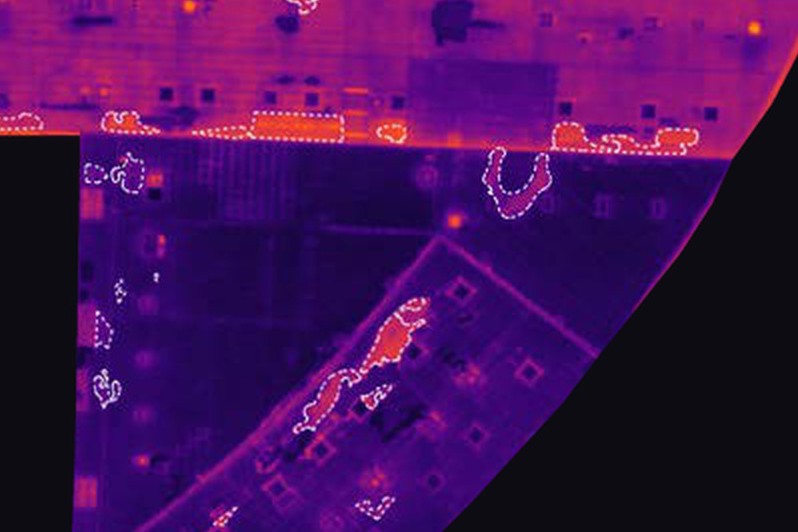
Read a thermal roof scan in three passes. First the whole-roof map: where the outlined areas sit and how much of the roof they add up to. Then each area’s page: its size in square feet and how many degrees warmer it read than the dry roof around it. Then the daylight photo beside the thermal one: what is physically there.
The colors show surface temperature, not water. Every outlined area is a suspect until a core sample confirms it; the map says where to cut, and the totals say how many square feet are in question. The examples come from the sample scan on this site: a sample from a real scan, with the address, the people and the companies removed and the map re-oriented. The sample shows the map and the image pairs; a full scan from us also comes with video from the flight and a written assessment of what the scan found.
Start with the whole-roof map
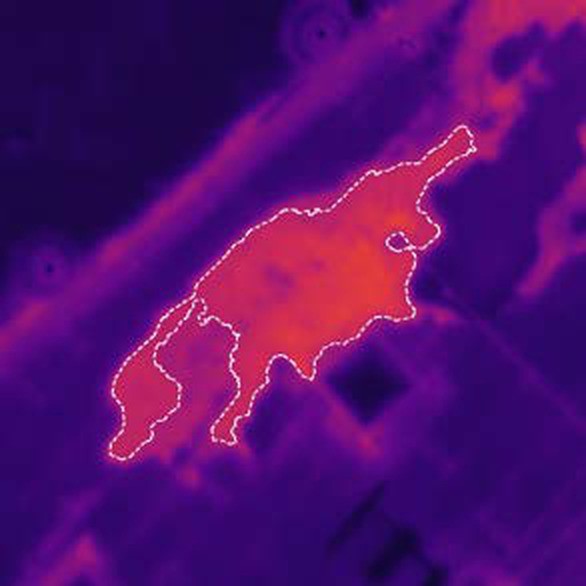
Wet insulation under the membrane holds the day’s heat longer than dry insulation, so after sunset the surface above it stays warmer, and the map draws that surface temperature. The sample draws warmer as brighter. Whatever palette a report uses, find its legend before reading a color.
Color alone proves nothing. As NRCA’s Professional Roofing magazine put it, “infrared imagers do not see moisture; they see temperature differences.” Read the printed figures, not the shade.
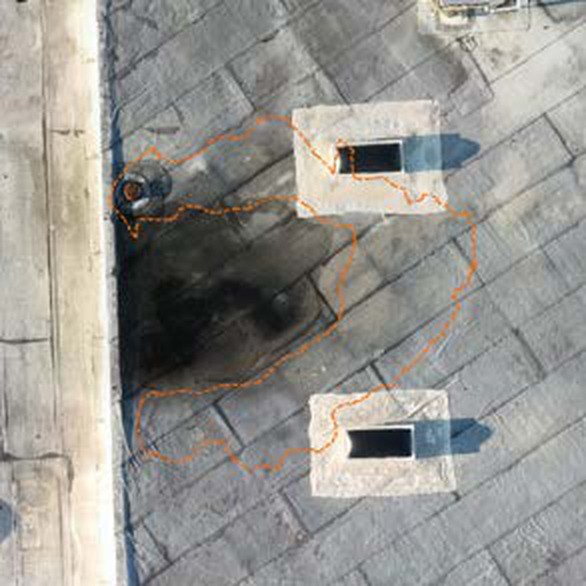
The dotted outlines are the findings: white dots on the thermal image, orange on the daylight one, around each area that stayed warmer than the dry roof beside it.
Then find the totals. The sample roof is about 50,000 sq ft, and the scan flagged 28 areas adding up to 1,929 sq ft, or 3.8% of it. It was flown on a clear evening about an hour after sunset. Check the conditions on any report: the method needs a sunny day followed by a clear, dry, calm evening.
The numbers on each area’s page
| Figure | What it is | How to use it |
|---|---|---|
| Area flagged, sq ft | The area inside the dotted outline, estimated from the air | A first measure of what may come out; the cut line is set on the roof |
| Degrees warmer | The area’s warmest reading against the dry roof right around it | Signal strength; compare areas by this |
| Peak temperature | The warmest reading inside the outline | Little on its own; the whole roof is cooling through the evening |
| Roof-wide baseline | One dry-roof temperature for the whole map, where a report prints one | Context, not the yardstick for any one area |
Degrees warmer is the figure people misread. Dry roof is not one temperature: on the sample’s whole-roof map, one section of roof reads brighter overall than the section beside it. So the fair comparison for any area is the dry roof right beside it, as the sample does for every one. One area peaked at 87.2 °F and another at 86.5 °F, yet the second was the stronger finding: 10.5 °F warmer than its surroundings against 8.7 °F.
Read the daylight photo beside the thermal one
Each pair shows the same patch of roof, so the warm shape can be laid over what is physically there. Most clues cut both ways.
| Daylight shows | Why it could be wet | Why it could be something else |
|---|---|---|
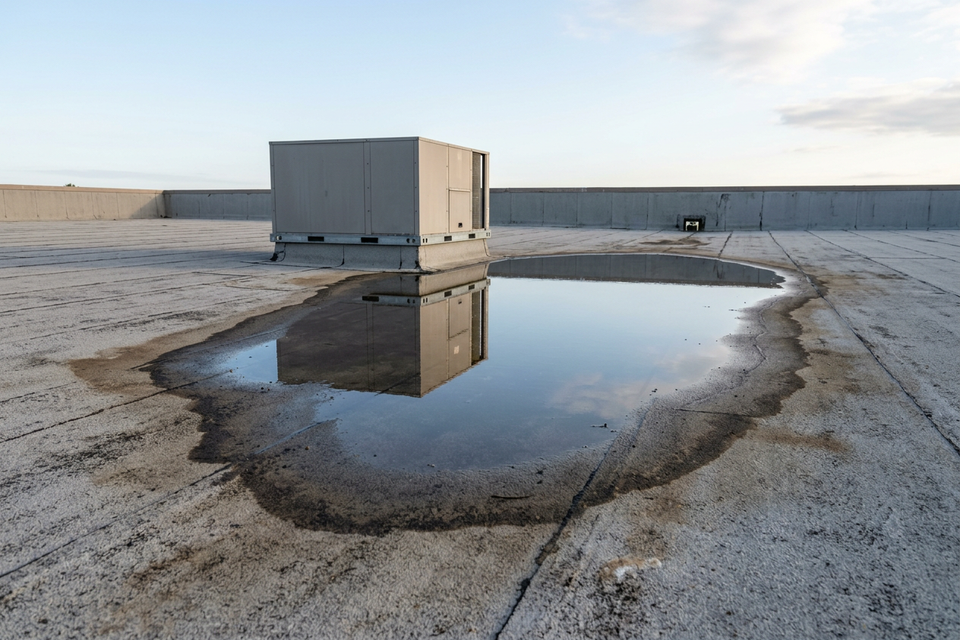
| A dark ponding stain | Water stands there after rain | Standing water and dirt can read warm on their own |
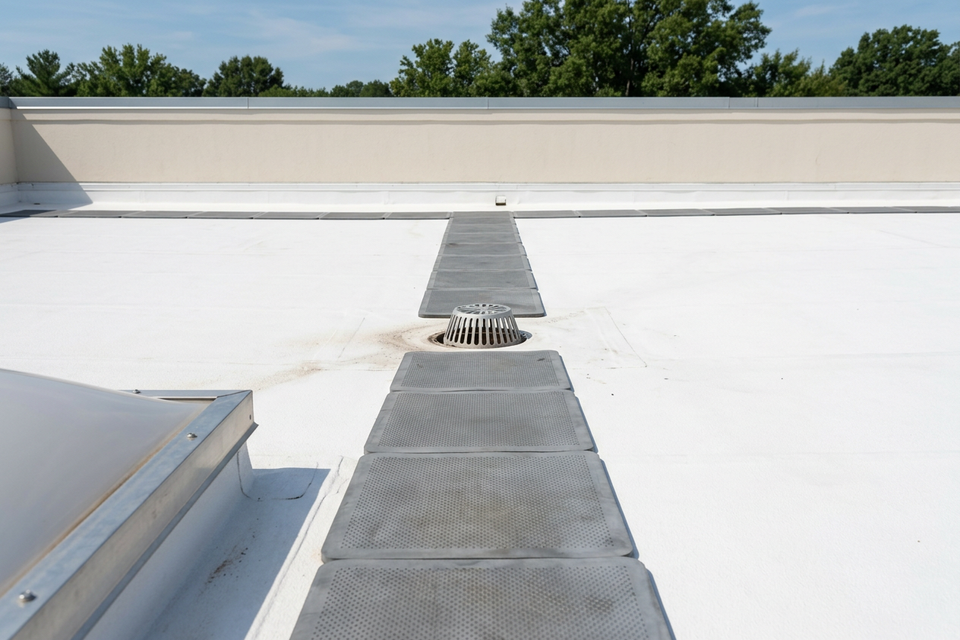
| A curb, pipe or rooftop unit | A flashing is a place water can get in | Units exhaust warm air |
| A patch | Someone has chased a problem here before | Extra membrane thickness can read warm on its own |
| A plastic cover | Somebody already knows about the spot | A different surface can read differently to the camera |
| Nothing at all | No other explanation is on view | Only a core can say |
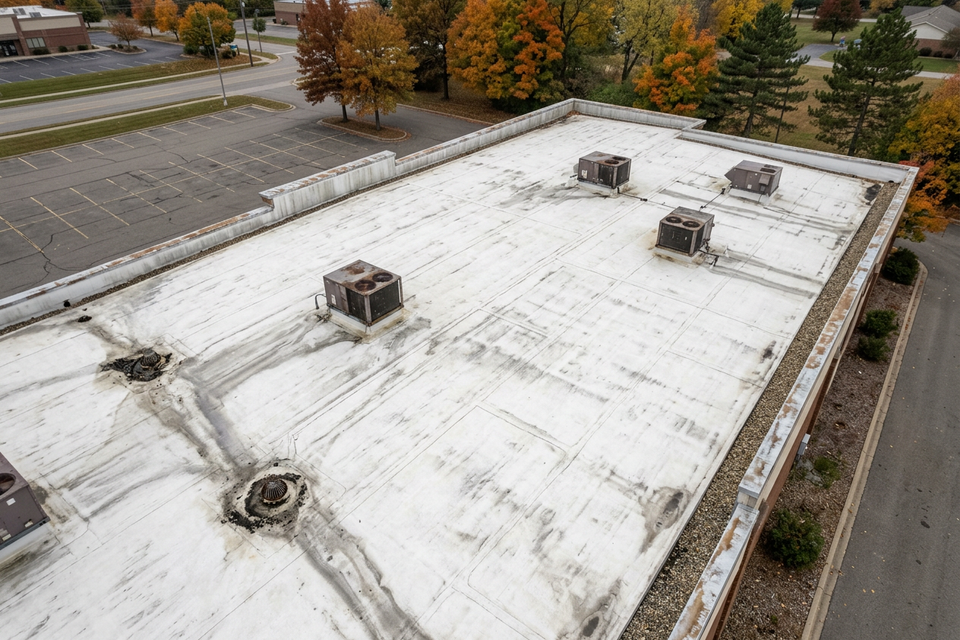
The sample’s warmest area is a long strip beside two rooftop curbs, stained in daylight: 204.7 sq ft, 14.5 °F warmer than the dry roof around it. Another rings a dark ponding stain between two curbs: 176.2 sq ft, 8.5 °F warmer. A third lies under and around a temporary plastic cover: 112.7 sq ft, 10.5 °F warmer. And one shows nothing in daylight, only a clear warm patch of 34.2 sq ft reading 9.5 °F warmer. That is the case for the camera: nothing on the surface leads anyone to it.
Rank the findings
A report with 28 outlines needs an order. Four things set it.
- How much warmer. A large difference from the dry roof beside it is a strong signal.
- How big. Size drives the square footage that may come out. The sample’s areas ran from 2 sq ft to about 206 sq ft.
- Where it sits. An area that starts at a penetration, a lap, a drain or a low spot has a visible way in for water.
- What shape it is. Wet insulation tends to show as straight-edged rectangles that follow the insulation boards, or as irregular shapes where water has spread.
Nine of the sample’s 28 areas were less than 5 °F warmer than their surroundings. They rank low and still get looked at. Faint is not the same as dry: wind takes the edge off a thermal pattern. Coating makers, Sherwin-Williams included, require wet insulation to be found and replaced before a coating goes on, and a coating laid over a wet area seals the water in, however faint it looked on a map. Wet roof insulation explains why it comes out first.
What reads warm without being wet
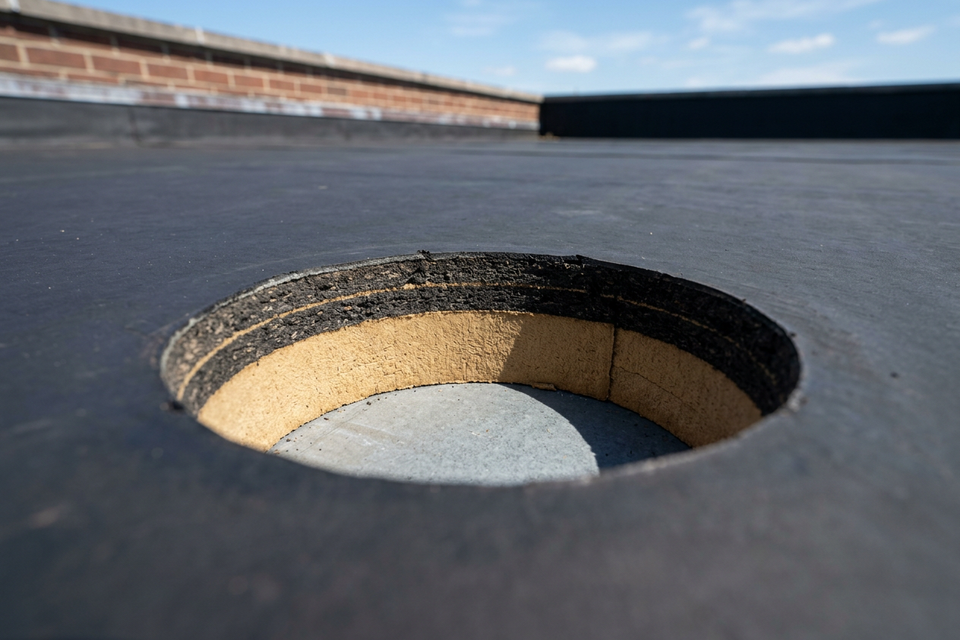
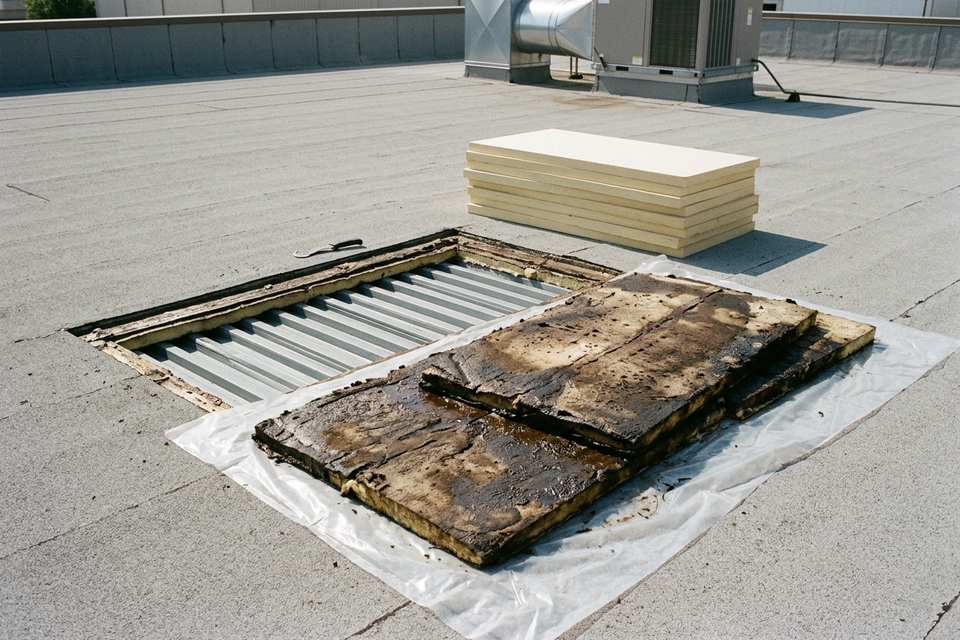
Warm exhaust from rooftop equipment, standing water, dirt and debris, a change in membrane thickness and the penetrations themselves can each produce a warm area with dry insulation under it: a false positive. Cutting out roofing on the strength of one is a costly mistake, which is why outlines get cored before anyone prices the work.
The scan also cannot see under rooftop equipment, and it does not say where the water got in or why. An area with no outline is one where nothing showed that evening; that is not proof the insulation under it is dry. A completely saturated roof may show a mottled pattern with no clear outlines.
Which areas to core first
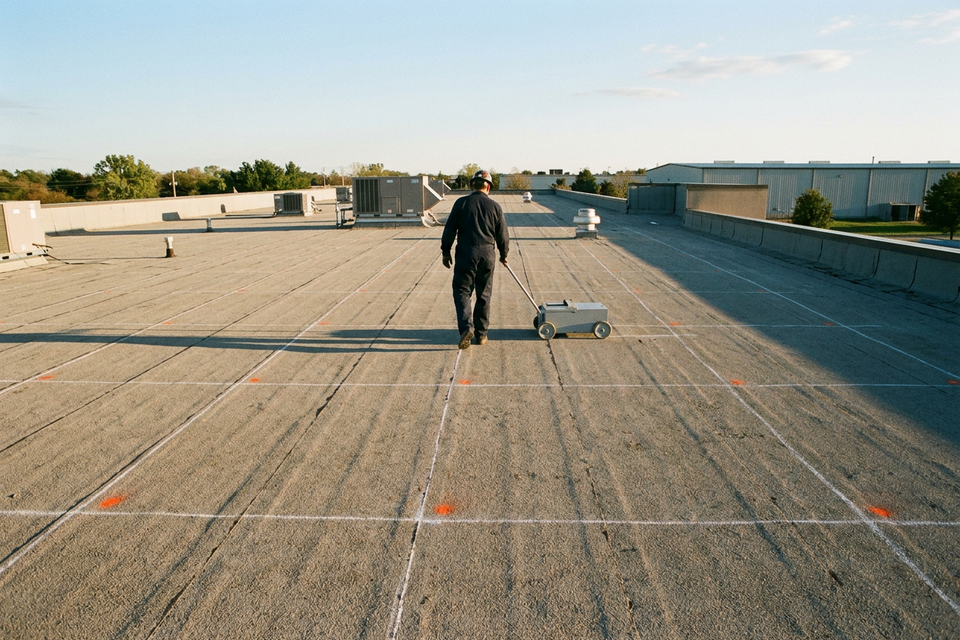
A core is a small cut through the assembly that shows how many layers are there, what the insulation is and whether it is wet. ASTM C1153 is the standard practice for locating wet insulation with infrared imaging, and its scope includes verifying the infrared data with invasive tests. Every reading on the map is relative; a core turns it into a fact. How many cores, and where, is the contractor’s call. Moisture-meter probes can add to the cores; they do not replace them. A sensible order:
- The strongest, largest areas, which move the scope most.
- An area with nothing to see in daylight.
- One or two faint ones, to see how the bottom of the range behaves.
- Any area with a rival explanation, such as a ponding stain or a patch.
- A control core in an area the map shows as dry.
The control core matters because every degrees warmer is measured against dry roof nearby: the map leans on that reference being dry, and one cut checks it. It also shows what the insulation is: closed-cell foam does not hold water, so it does not show wet on a thermal scan, and such a roof is surveyed another way. Each core is patched the day it is cut; on an asphaltic roof, wet-dry roof cement KST058600 takes a repair wet or dry. Core samples: how a scan gets confirmed covers the rest.
What the totals decide, and what they do not
The total at the top of the report is the first draft of a budget line: square feet of roof to cut out and put back before the rest is restored. On the sample that draft is 1,929 sq ft in 28 places, 3.8% of the roof. Nothing was cored, so every one of those square feet is suspected, not confirmed.
The total feeds one question: a coating with a few sections replaced first, or so much wet insulation that replacing the roof makes more sense. As a rule of thumb, and not as a code or a standard, manufacturers commonly draw the line somewhere between 15% and 30% of the roof being wet. Set the sample’s 3.8% beside that range, remembering it is a total of suspected square feet that cores can shrink or grow.
The total does not decide alone. It says nothing about the deck, the membrane, the drainage or how many layers of roofing are already on the building. The installer looks at the roof and says whether it is a good candidate for restoration; the building’s engineer answers anything structural; the local building department says what is permitted. From moisture map to restoration scope shows how confirmed areas become a scope and a material count, and the cost page sets the typical installed ranges for restoring and replacing side by side.
Before acting on any report, ask four things: what the conditions were on the evening, which baseline the differences were taken from, which areas will be cored, and where the control core goes.
To see whether a thermal scan suits a particular roof, run the scan-fit tool. We arrange scans for commercial low-slope roofs anywhere in the US. Then request a moisture scan: we fly only with the owner’s go-ahead, and nothing about the roof has to be decided until you have seen the map.
Last updated 2026-10-05.